
The State Of Growth 2023: Distributor Benchmarking

In the State of Growth 2023's distributor benchmarking, PPAI Media Publisher and Editor-in-Chief Josh Ellis notes the likelihood of the survey incentive skewing data among smaller company respondents. It is worth remembering, however, that PPAI’s 2022 Sales Volume Estimate showed a rebound year for distributors making less than $2.5 million.
The following survey questions, which were also used to score the inaugural PPAI 100's Growth category, reveal how distributors at multiple competitive bands in the marketplace compare to one another.
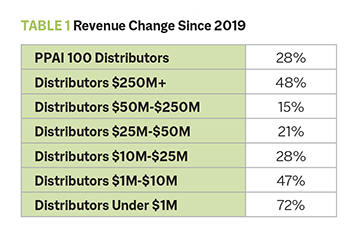
Steve Brungart of ShowYourLogo says that the process of doing business and reacting to global and economic conditions kept his distributorship so busy that he never thought to look up those growth numbers for his own company, which turned out to be in line with his segment.
Brungart is also eager to see what average revenue change from 2022 to 2023 will look like. “We started out very strong for 2023 but hit a slow patch in the third quarter,” Brungart says. “Things are starting to ramp back up. We’ll probably beat our 2022 numbers, but it’ll be close.”
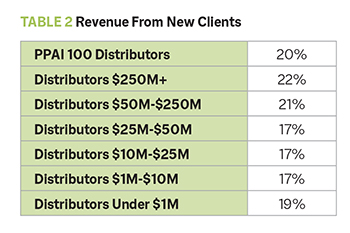
Ross Silverstein, president and CEO of iPROMOTEu, sees these new client numbers as higher than expected and leaves him with as many new questions as answers. “Across the board, roughly 20% of billed revenue is coming from new clients,” Silverstein says. “Given that all categories are experiencing this 20% phenomena, the business isn’t moving from one group to another. Rather, the overall business must be increasing – but 20% is inexplicably high.”
As a whole, the industry grew 15.6% in 2022, according to PPAI’s Sales Volume Estimate.
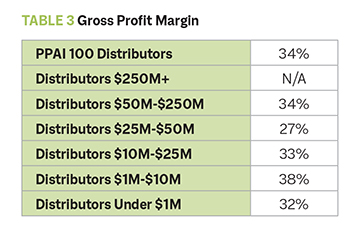
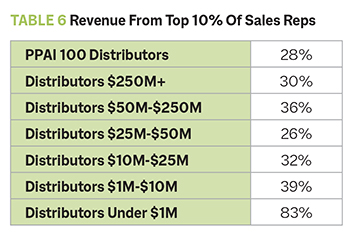
These segments show less variance than what the supplier data is showing. There are some outliers ($25 million-$50 million at 27% and $1 million-$10 million at 38%), but Brungart finds it interesting that the segment of smallest companies lines up so closely with the PPAI 100 overall.
“No matter big or small, it all equals out in the end,” Brungart says.
Note: Not enough distributors making above $250 million reported data for this question to be accurately scored for that segment.
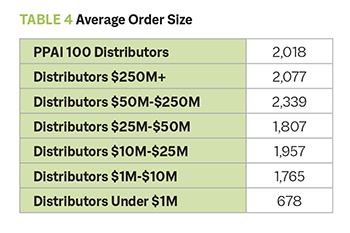
It may not be surprising that larger firms, which often have the resources to service the largest national and multinational clients, would be more likely to run a higher average for the amount of products in a given order.
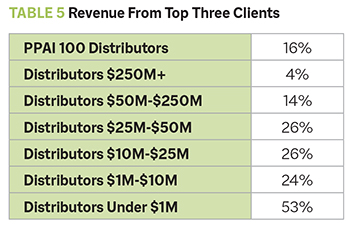
While all segments have been generating a healthy amount of revenue from new clients (as noted above), smaller companies are more reliant on their top clients than the industry’s largest companies. This is a potential example of imbalance in the industry, as such a high percentage (45%) for companies generating under $1 million in revenue puts those companies at greater risk of being affected by outside circumstances.
While it suggests that companies in those segments form strong relationships with their clients, it could create difficulties if any of those top clients are impacted by future economic conditions.
“Loss of a large client can be detrimental to the smaller distributor, which only enhances the need for increased efficiencies, top level customer service and continued education to keep this group at the top of their game,” says Kara Keister, MAS, co-owner of distributor Social Good Promotions.
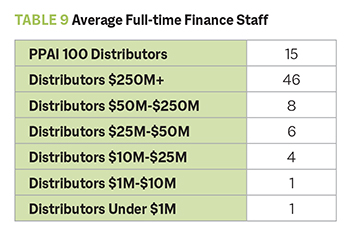
As you will see below, distributors under $1 million in revenue are averaging only two full-time sales reps. With a smaller pool of sales reps to draw from, it stands to reason that the top performers – often the owner-operator – would account for most sales.
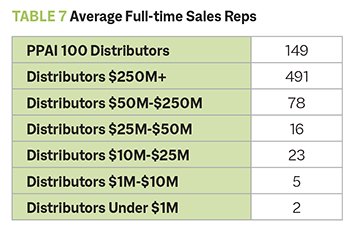
This is the first example of a large contrast between staff size in segments that repeats in the next two categories. Predictably, the largest distributors have a much greater pool of sales reps working for them.
This does not necessarily guarantee an obvious ceiling for companies with fewer sales reps, however. Savvy investments in technology and online orders can often eliminate friction in the order process, which could give some companies the ability to operate at a high level with fewer customer service personnel. This could help account for the $25 million-$50 million segment staffing a low number, or it’s simply an oddity of the survey sample.
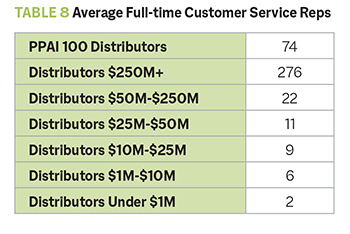
Across all segments, distributors have about half or fewer customer service reps than sales reps. In the case of the smallest companies, however, that creates a greater burden of responsibility for that position, as it is often handled by one or two employees who are likely also performing sales functions.
The staffing trend continues with the industry’s smallest distributors, but Valerie Hayman Sklar, president of Corporate Specialties, points out that, as the companies get smaller, the lines begin to blur in the exact definition of their jobs and responsibilities.
“I think what most popped out to me is the under $1 million [companies] have a lot less employees than the other groups,” Hayman Sklar says. “As part of that group, we wear a lot of hats, from finding new clients to sales and delivery. They also work with fewer clients than the larger distributors.”
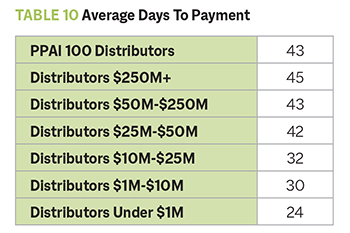
This category represents a potential advantage for smaller distributors. Many large distributors would love to receive payments as quickly as the under $1 million segment is averaging.
“This could be due to a range of factors, including difference in clientele, lack of payment terms with suppliers and simple survival instincts,” Keister says. “The ability to finance a large order for a lengthy period of time can be a roadblock for the smaller distributor. This statistic, to me, shows that the under $1 million crowd is financially aware, savvy and is transparent with their customer base about terms of service.”