The Year Of The Pivot: But Sales Still Plunged

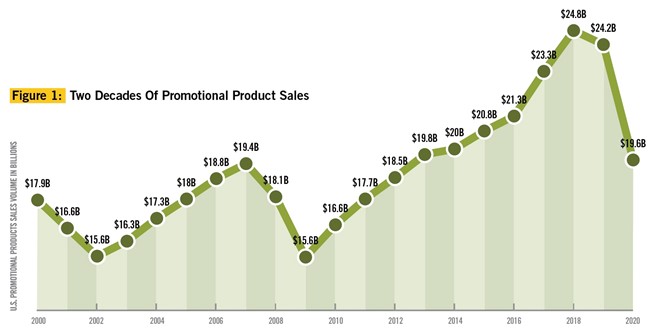
In 2020, the COVID-19 pandemic triggered staggering economic woes for most businesses around the world, and sales in the promotional products industry were hit hard as well. For the year, distributor sales volume dropped by 19 percent to $19.6 billion—falling under $20 billion for the first time since 2013, according to PPAI’s annual Distributor Sales Volume Estimate (see Figure 1).
When events, trade shows, travel and large gatherings were cancelled starting in Q1 2020, and restaurants, retail stores and venues temporarily closed their doors as well, most distributors experienced an avalanche of order cancellations. To stem the revenue loss and meet new demands, many distributors turned to selling personal protective equipment (PPE). This move helped many companies to mitigate the full impact of the shutdown with nearly eight in 10 distributors (76.5 percent) redirecting some resources to the sales of PPE, which represented 16.8 percent of the total sales volume across distributors in 2020. Without PPE sales, the industry is likely to have experienced even more significant losses.
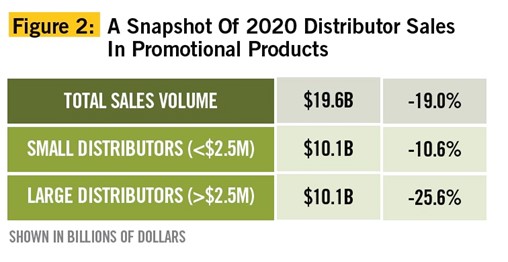
It was a year that took no prisoners—both large and small distributors experienced negative growth, but large distributors were especially hard hit. While small distributors with total industry sales of approximately $9.5 billion spiraled down (10.6 percent) at a faster pace from the decline that started in 2019 (3.7 percent), for large distributors, the average decline was even steeper. Distributors in the $2.5 million-plus annual sales bracket recorded sales of $10.1 billion, showing an average loss of 25.6 percent over 2019 (see Figure 2).
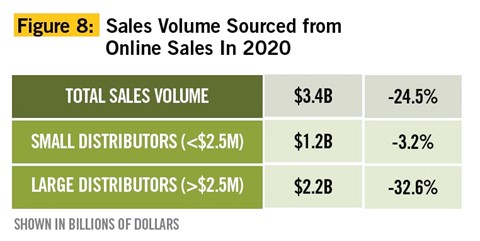
With millions of workers moving to home offices for most of 2020, online shopping rose across most consumer goods categories, but the share of online sales for promotional products (17.3 percent) remained close to 2019’s percentage (18.6 percent). Online sales also declined proportionally with the total sales volume by falling 24.5 percent to $3.39 billion compared to $4.49 billion in 2019. The decline in online sales was steeper for large distributors (down 32.6 percent) compared to small distributors (down 3.2 percent).
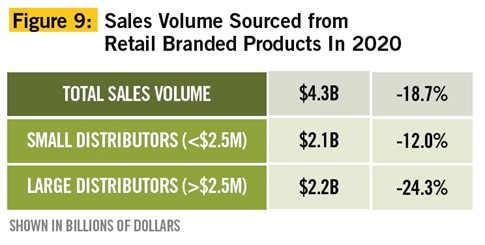
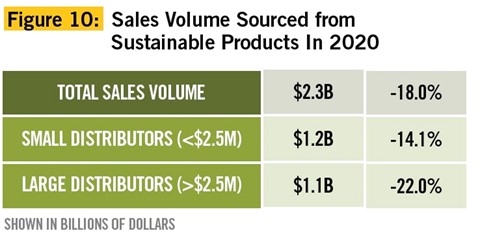
In fact, distributor sales fell across the board. On average, sales of products sourced from non-industry providers fell 18 percent from $3.6 billion in 2019 to $2.95 in 2020 and made up 15 percent of the total dollar volume. Likewise, sales of retail-branded and sustainable products also decreased by 18.7 percent and 18 percent, respectively.
PPAI has researched and released industry sales data since 1965. This annual distributor sales study for PPAI is generally considered the most definitive and comprehensive of its kind in the industry based on actual sales reported by U.S. promotional consultant companies. The survey was conducted by Relevant Insights LLC, an independent market research, on behalf of PPAI.
––––––––––––––––––––––––––––––––––––––––––––––––––––––––––––––––––––––––––

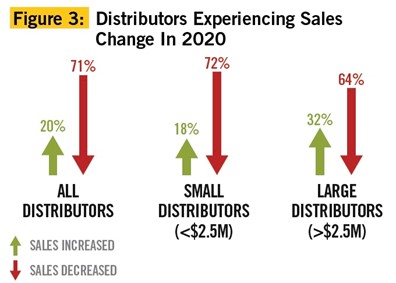
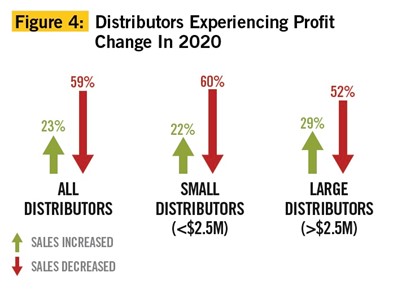
Overall, most distributors, regardless of size (71 percent), reported sales down by 20 percent compared to 2019, while only 20 percent reported increased sales in 2020 vs. 60 percent in 2019. Compared to 2019, significantly fewer large distributors reported increased sales in 2020 (32 vs. 76 percent in 2019). The number of smaller distributors with increased sales also declined drastically (18 vs. 58 percent in 2019) (see Figure 3). In addition, 59 percent of all distributors reported a drop in profits with 60 percent of small distributors and 52 percent of large distributors experiencing a profit reduction in 2020 (see Figure 4).
––––––––––––––––––––––––––––––––––––––––––––––––––––––––––––––––––––––––––

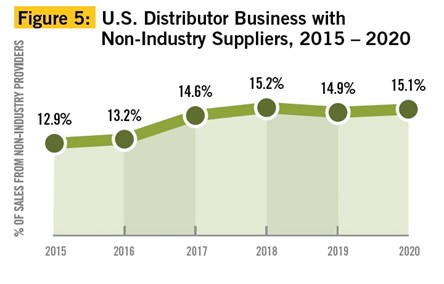
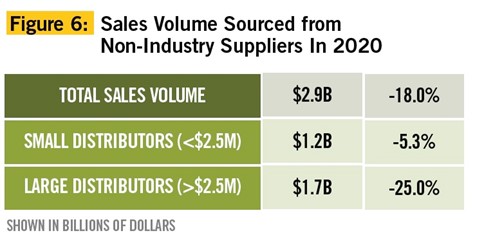
The number of distributors doing business with non-industry suppliers in 2020 remained relatively unchanged across distributor segments (see Figure 5). However, sales from products sourced through non-industry providers decreased by 18 percent over 2019. A significant decrease was observed among large distributors (25 percent) (see Figure 6). Collectively, distributors of all sizes sold $2.95 billion in products from non-industry providers in 2020—or 15.4 percent of the total dollar volume.
––––––––––––––––––––––––––––––––––––––––––––––––––––––––––––––––––––––––––
![]()
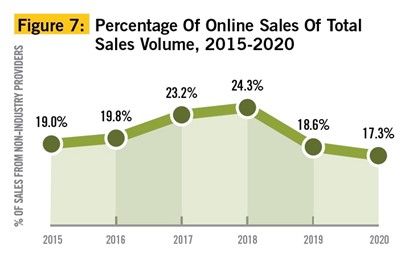
Online sales of promotional products in 2020 are estimated to be $3.39 billion or 17.3 percent of total industry sales (see Figure 7). Online sales decreased 24.5 percent over 2019, a decline that was steeper among large distributors (32.6 percent) than among small distributors (3.2 percent) (see Figure 8). For the purposes of this study, online sales are defined as buys resulting from orders placed through an online store or website and are not to be confused with salespeople transmitting orders online.
––––––––––––––––––––––––––––––––––––––––––––––––––––––––––––––––––––––––––

Sales of retail branded products are estimated to be $4.35 billion or 22.2 percent of the industry total sales in 2020 (see Figure 9). This represents an 18.7-percent decrease over 2019 and refers to brand-name, consumer-facing products that add a sense of distinction to incentive and recognition programs as well as individual end-user gifts. Examples include Yeti, Maui Jim, TUMI, Nikon and many more.
––––––––––––––––––––––––––––––––––––––––––––––––––––––––––––––––––––––––––

For the first time in the 2019 sales volume survey, a question was asked about sales of sustainable products. In the 2020 survey, that category also declined by 18 percent compared with 2019 and is estimated to be $22.8 billion or 11.7 percent of the industry total sales (see Figure 10). For this study, sustainable products sales are defined as the net sales of products marketed to consumers for their eco-friendly attributes either through production, use or disposal.
––––––––––––––––––––––––––––––––––––––––––––––––––––––––––––––––––––––––––

As expected, sales declined across most promotional product categories, but apparel still reigns as the biggest seller despite also experiencing a decline. Promotional apparel comprised 26 percent of total sales in 2020, followed by drinkware at 8.5 percent, fashion accessories at 5.8 percent, travel/bags at 5.2 percent, writing instruments at 4.9 percent, office products at 4.7 percent, tech products at 4.2 percent and awards at 3.4 percent to round out the top eight categories. Seven product categories reported growth in 2020 over 2019:
- Medical and Safety (105 percent)
- Other (72 percent)
- Home/Kitchen (38 percent)
- Hygiene and Grooming (35 percent)
- Packaging (27 percent)
- Labels (12 percent)
- Office (four percent)
––––––––––––––––––––––––––––––––––––––––––––––––––––––––––––––––––––––––––

Promotional product sales also declined across most industries. Sales to the business services (B2B) industry, which had emerged as the most active buyer of promotional products in prior years, declined drastically in 2020. Taking its top spot was, not surprisingly, the health care industry with a four-percent increase in sales, most likely due to PPE sales. However, these four industries also saw an uptick in sales during 2020:
- Retail (57 percent)
- Recreation/team sports (44 percent)
- Food and beverage (14 percent)
- Media and publishing (7 percent)
––––––––––––––––––––––––––––––––––––––––––––––––––––––––––––––––––––––––––
![]()
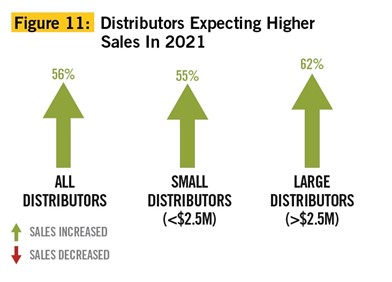
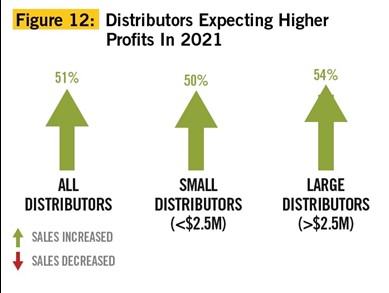
After a tumultuous year, most distributors are understandably cautious when making their predictions for 2021. Many hope to see an economic recovery by mid to end of the year, but their uncertainty is palpable as it is still unclear as to when events and large gatherings will come back to prior years’ levels. About one in two distributor companies that participated in the 2020 survey say they expect higher sales and profits for 2021, especially among large distributors (see Figures 11 & 12). When asked about how 2020 started, more than 60 percent of distributors said they had expected higher sales and profits for the year. In contrast, many distributors were still experiencing the negative impact of the COVID-19 pandemic at the beginning of 2021 (when this survey was conducted), and fewer say they are expecting positive grow in sales or profit this year. Read more about what distributor principals are saying about their sales over the past year and what they see for 2021 in the story here.
––––––––––––––––––––––––––––––––––––––––––––––––––––––––––––––––––––––––––
Methodology: Behind The Facts
To compile PPAI’s 2020 Estimate of U.S. Distributors’ Promotional Products Sales, the survey was distributed via email to both PPAI member and nonmember promotional consultant companies.
The top 50 distributors were also reached by phone to ensure their information was included in the analysis since omission of any distributor with a large volume of business could distort the statistics.
Data from prior research conducted by PPAI and PPAI’s database were also used in the sales volume estimation.
––––––––––––––––––––––––––––––––––––––––––––––––––––––––––––––––––––––––––
Get The Full Report
Additional data and charts, including top-selling product categories and programs, are available for PPAI members at www.ppai.org/members/research. A member log-in is required. For questions on this report, email Keith Vincent, director of marketing at KeithV@ppai.org.
––––––––––––––––––––––––––––––––––––––––––––––––––––––––––––––––––––––––––
Michaela Mora is principal of Relevant Insights, LLC.