
10 Reasons Ad Spending Is Up

Editor’s Note: PPB’s May cover story reported key findings from PPAI’s 2018 Sales Volume Study, including sales revenues and market share by distributor size, and year-over-year comparisons for overall sales, profits and sales with non-industry suppliers, among others. The following article, with data from PQ Media, expands the reporting to look at 2018 revenue across the entire advertising and marketing landscape along with trends that spurred the growth.
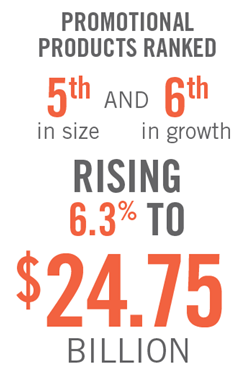
U.S. advertising and marketing revenue reached $500.19 billion overall in 2018, a 5.5 percent increase over 2017. Within the segments that comprise this total, advertising media rose 4.5 percent to $195.6 billion and marketing media grew 6.1 percent to $304.59 billion. Of the 13 advertising and marketing silos, television was the largest in 2018, reaching $100.64 billion. Entertainment media was the fastest growing advertising and marketing silo in 2018, soaring 21.4 percent. Promotional products ranked sixth in both size and growth in 2018, rising 6.3 percent to $24.7 billion. (Note that promotional products advertising is not a silo, but a channel within the promotional marketing silo, and it has been extracted in this article for context with overall brand marketing trends.) See the chart on page 82 for 2018 size and growth of the 13 media silos tracked in PQ Media’s Global Advertising & Marketing Revenue Forecast 2018-22.
![]() 2018 Elections
2018 Elections
There were more contentious elections in 2018 than ever before with toss-ups in eight Senate campaigns, 30 House seats and nine governor races, as well as an additional 17 House and governor races in which the opposing party was favored to unseat the incumbent party (64 total). Since 2000, no election has had more than two dozen toss-ups with incumbents losing. As a result, PQ Media estimates that overall U.S. political media buying reached $6.58 billion in 2018, a 9.6 percent increase over the 2014 campaign. (Note: the 2014 election cycle is being used for the comparison rather than the 2016 campaign because the presidential campaign skews the results). Many of the 13 advertising and marketing silos exhibited higher growth rates due to the infusion of more even-year political dollars.
![]() 2018 Winter Olympics
2018 Winter Olympics
Historically, brands increase budgets for branded entertainment sponsorships and in-store retailing in every even-year in which global sporting events are held. However, the budget increase in 2018 was less than reported in 2016 for two reasons. First, brands spend more when the Olympics are held in locations where live events can be viewed throughout the day, such as in Brazil in 2016. South Korea, the location for the 2018 Olympics, is 13 hours ahead of Eastern Standard Time. Second, the Winter Olympics are less popular than the Summer Games because most winter sports tend to be followed primarily by residents of northern and midwestern states.
![]() Economy
Economy
The U.S. economy remained strong in 2018, bolstered by the Trump tax cuts. Brands increased budgets in certain verticals, particularly relating to holidays, because consumers increased their discretionary spending compared with 2017.
![]() Multicultural Media
Multicultural Media
Brands are shifting away from a “Total Marketing” strategy adopted by some advertisers soon after the Great Recession. With this strategy, they purchased inventory on media content that had a diverse audience matching census data (e.g., a Super Bowl audience might be 18 percent Hispanics, 15 percent African Americans, six percent Asian Americans). According to a recently released report on multicultural media from PQ Media, in partnership with the Association of National Advertisers, brands are finding that this total marketing strategy lacks engagement with multicultural audiences leading to a decline in market share. Increasingly, brands are using agencies that understand multicultural audiences and which develop culturally relevant messages using media channels that resonate with these audiences.
![]() Retailer Woes
Retailer Woes
More franchises filed for bankruptcy and shuttered retail outlets in 2018 than were reported in 2017, which also exceeded the number of closures during the Great Recession. Companies that shuttered all stores included: Bon-Ton, Brookstone, Gump’s and Nine West. Sears avoided that fate when a last-minute deal was struck with a hedge fund. As a result, select brand marketing channels, such as point-of-purchase, coupons and trade promotions, continue to be under stress.
![]() Social Media Data Breaches
Social Media Data Breaches
Consumers are becoming more protective of their digital information after the Facebook announcement and Congressional testimony revealed it shared private data without permission with a research company that was used to influence the 2016 elections. Millions of end-users closed their Facebook accounts or increased privacy settings not only on Facebook, but across all social media sites, making it harder for brands to connect with customers on websites that previously provided strong ROI results.
![]() Digital Ad Fraud and Placement
Digital Ad Fraud and Placement
Research released in 2018 reported that ad fraud is worse than initially estimated, with an estimated half versus one-third of all digital dollars ($35B vs. $23B) spent being wasted because of fraud. Simultaneously, brands continue to complain that programmatic media buying causes their advertisements to be placed near objectionable content, leading brands to drop advertising on sites like YouTube.
![]() Smart Technology Marketing
Smart Technology Marketing
Brands increased spending on smart tech marketing by nearly 400 percent in 2018, according to the PQ Media U.S. Smart Technology Marketing Forecast 2019, as more advertisers are relying on artificial intelligence (AI), augmented reality (AR), internet of things (IoT), voice assistance (VA) and virtual reality (VR) marketing to develop and distribute brand messages. PQ Media identified more than 150 brands that have used smart technology marketing to actively engage consumers, such as a Fitbit campaign using AI that ran on TNT’s Inside the NBA, BMW’s AR simulators in showrooms, the New York Times’s VR ads for movie trailers, O Magazine’s use of VA for Oprah Winfrey’s “Favorite Things” series in which smart speaker users were sent to websites to purchase products and Tide using IoT to alert Amazon when consumers needed to reorder Tide soap pods.
![]() AI and Big Data
AI and Big Data
PQ Media estimates that brands spent over $5 billion using AI as a research tool in 2018, representing almost 10 percent of marketing information budgets, up from a 0.1 percent share in 2013. AI sifts through billions of bytes of daily data to isolate lifecycle trends related to specific target audiences. As a result, brands are better able to personalize marketing campaigns. For example, AI helped a retailer identify couples who were having babies by noting specific products they purchased before the birth. The retailer began sending personalized messages via direct mail and e-mail that matched the child’s age (e.g., diapers and changing tables, followed by toys and bikes and, in upcoming years, technology and dorm room furniture, etc.).
![]() Television’s Death Is Exaggerated
Television’s Death Is Exaggerated
Many non-TV media operators are attempting to persuade brands to shift budgets away from television because viewership is down. That is fake news. According to multiple studies, viewership continues to climb annually, although the method by which video is being consumed is changing. Appointment television viewing of linear, live television is down, but conversely on-demand television viewing on digital and over-the-top (OTT) systems is growing substantially, with the latter driving viewership outside the home. Concurrently, consumers have more choices for content, with almost 500 scripted programs available in 2018, compared with less than 300 in 2009. OTT providers like Netflix, Amazon and Hulu, spent more than $10 billion on original programming to drive subscription growth.
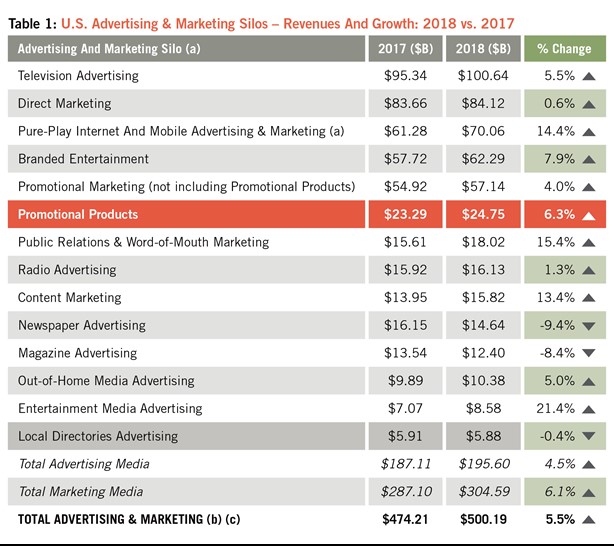
Note: 2017 revenues for all media categories (except for promotional products) have been updated since they were first published in PPB's July 2019 issue because of recent adjustments in the data reported from various sources. Source: PQ Media's Global Advertising & Marketing Revenue Forecast 2018-22, except for promotional products; the source for that data is Promotional Products Association International.
* To avoid marketing revenue duplication in media silos, Pure-Play Internet & Mobile Advertising & Marketing is specific to online and mobile sites that are not connected to traditional media brands, such as Google, YouTube, TripAdvisor and e-Harmony. Advertising and marketing revenues generated by digital extensions of traditional media brands (ex., CBS.com) are included in that traditional media silo (ex., Television). The Global Advertising & Marketing Revenue Forecast is one of three reports in PQ Media's annual Global Media & Technology Forecast Series, which also includes the Global Consumer Media Usage & Exposure Forecast and teh Global Consumer Spending on Media Content & Technology Forecast. The 2018 edition of the Global Media & Advertising Forecast will be available in July. Some data included in the Global Advertising & Marketing Revenue Forecast are gleaned from other PQ Media syndicated reports covering specific advertising and marketing platforms, such as the Global Design Out-of-Home Media Forecast, Global Branded Entertainment Marketing Forecast, Global Content Marketing Forecast, US Brand Activation Marketing Forecast, US Mobile and Social Media Forecast and US Word-of-Mouth Marketing Forecast, among others.

 Television advertising growth historically fluctuates, rising in even years and falling in odd years. With the Winter Olympics and political media buying, overall television advertising rose 5.5 percent in 2018 to $100.64 billion. Politics also drove growth in the cable industry, as news networks reported the highest ad revenues ever due to the 2018 election coverage. Organic growth (when politics and sports are excluded) rose slightly for the first time since 2011 due to a strong economy. There was concern, however, that NFL ratings would continue to decline 2018 as a reaction to athletes kneeling during the national anthem; however, those fears were unfounded, and the NFL’s telecast CPM (cost per thousand) rates were the highest for regularly scheduled primetime programs.
 Like television, this media silo exhibited growth trends in 2018, propelled by direct mail, e-mail and telemarketing campaigns run by politicians, although direct marketing only inched up 0.6 percent to $84.12 billion in 2018. List management firms also reported solid growth as big data firms continue to aggregate multiple lists. However, when political is excluded, organic growth declined in 2018 as numerous print catalogs shuttered and brands cut back direct mail campaigns due to a postage rate hike in 2018. Meanwhile, direct response TV growth was flat, with no major new campaigns developed during the year.
 Pure-play internet and mobile media registered a 14.4 percent increase in 2018 to $70.06 billion. Mobile advertising and marketing registered a double-digit increase in 2018, but growth decelerated due to the aforementioned digital data breaches and ad fraud. Also, consumers are increasingly installing ad blockers on their smartphones, so brand ads are not viewed. Internet usage, defined as accessing websites via PC’s and laptops, continues to fall, resulting in declining growth among the major ad channels like online search and displays. It should be noted that if pure-play internet and mobile media were combined with the digital brand extensions of traditional media operators, total digital advertising and marketing would show growth of approximately 14 percent in 2018 to nearly $140 billion.
 Experiential marketing was bolstered by the influx of dollars from political campaigns, as many politicians attempted to emulate the success of Donald Trump’s strategy in 2016 to hold numerous events to drive voter engagement. Meanwhile, brands increased budgets for consumer events as well, particularly among minority audiences, to drive cultural engagement. Product placement rose at double-digit rates for the seventh consecutive year, driven by a strong cadre of blockbuster films with placements, and more innovative methods being used to integrate brands into television programs, such as shooting the video of an entire episode with branded video technology. These three factors fueled a 7.9 percent increase in branded entertainment in 2018, reaching $62.29 billion.
 The improving economy was a key driver behind the four percent gain for promotional marketing in 2018 to $57.14 billion. Incentives are being used more often by companies to keep key employees in an improving job market. Loyalty programs are becoming more sophisticated, particularly providing discounts to smartphone users. Sampling is being viewed as a method to engage with audiences, particularly in specialty stores such as bodegas. Premiums, particularly in the hospitality industry, grew during the year due to an increase in corporate travel. Brand licensing was helped by numerous Marvel-related blockbuster films with corresponding licensed toys and apparel. However, the closure of many retail outlets has adversely impacted the largest promotional channel, point-of-purchase displays, while a strong economy historically leads to fewer coupons being distributed and redeemed.
 As reported in the May issue, promotional products revenues rose 6.3 percent in 2018 to $24.7 billion. Smaller distributors (those with revenues under $2.5 million) spurred the growth, as companies reported double-digit growth compared with low single-digit gains at the larger promotional products distributors. Other contributing factors that spurred solid growth in 2018 included the continued shift to purchasing promotional products through digital platforms; almost 700 new distributor companies were launched during the year and an increase in promotional products usage by candidates during the 2018 election.
 Political campaigns turned to public relations firms in 2018 to drive free earned media, attempting to control the conversation like Donald Trump did in 2016. This resulted in a 15.4 percent increase in revenues to $18.02 billion. Often these same firms had to develop crisis communications campaigns when viral attacks on the politicians were successful, as well as with celebrities and corporate executives caught in the MeToo backlash. Word-of-mouth marketing surged as many brands linked social media campaigns with influencer marketing, seeking out key opinion leaders to drive product conversations, such as brands targeting the Hispanic market using popular DJ’s to promote brands and causes.
 Radio advertising rose 1.3 percent in 2018 to $16.13 billion, driven by the political campaigns in battleground states that have significant rural footprints, such as West Virginia and North Dakota. Each month, PQ Media became more bullish about radio’s growth in 2018 as Republican seats that were considered safe at the beginning of year became toss-ups. Radio listenership decelerated slightly as fewer automobiles were sold in 2018 compared with 2017. However, those declines were mitigated by an increase in radio listening among younger demographics on digital audio subscription services, such as Pandora and Spotify.
 Brands continue to turn to content marketing to reach key target audiences as engagement with traditional media platforms declines. Somewhat surprising is an increase in custom magazines being developed to reach customers, given the rapid decline in traditional print consumption. Many brands have also significantly increased budgets to sponsor digital videos and audio podcasts on sites like YouTube and Spotify. These two trends fueled a 13.4 percent growth in content marketing to $15.82 billion in 2018.
 Although subscriptions to online newspapers increased slightly in 2018, due in part to ongoing controversies surrounding the current White House administration, brands continue to shift ad dollars away from newspapers, except for a few exceptions. This led to a 9.4 percent drop in advertising in 2018 to $14.64 billion. Weekly papers haven’t suffered as much as dailies because there are fewer local digital competitors. Multicultural newspapers in native languages related to Asian-American cultures have remained strong because there are no major Asian TV networks, like Univision for Hispanics, so brands rely on newspapers to reach Chinese Americans, Indian Americans, Filipino Americans, Korean Americans, Japanese Americans and Vietnamese Americans.
 Although many magazines have adopted the 360-degree approach recommended by The Association of Magazine Media in which they provide content on all media platforms, particularly smartphones, the strategy has not yielded the desired results of generating enough ad revenue to compensate for losses in print advertising. As a result, overall magazine advertising declined 8.4 percent in 2018 to $12.4 billion. Business-to-business (B2B) magazines aren’t registering the same deep declines because the strong job market means more readers, most who already read B2B magazines online. Additionally, B2B publishers offer executives access to sponsored databases of vendor listings in key vertical industries, helping to drive engagement with B2B content.
 Out-of-home (OOH) was another silo that benefited from contentious political races, driving a five percent increase in 2018 to $10.38 billion. While most political ads are static billboards and lawn posters, there has been an increase in the use of digital billboards by campaigns. Among the cadre of digital OOH venues, transit has seen the strongest gain, particularly in transit locations and digital street furniture, such as New York City expanding its digital subway network to commuter train lines and bus routes. The OOH industry has also been proactive developing standardized metrics that cover both traditional OOH and digital OOH, developed through a partnership between operators and agencies, prompting wider acceptance of the methodology.
 Advertising on entertainment media (in videogames and recorded music, film and book websites), remained the fastest growing of the 13 media silos tracked in this report, rising 21.4 percent to $8.58 billion in 2018. Trends that drove growth include the increasing popularity of Fortnite; rising viewership of e-sports contests and an increase in ad-supported audio subscription sites, particularly Spotify. This media silo is expected to experience a spike in advertising within the next 18 months after Sony and Microsoft release an upgrade to the PlayStation and Xbox console systems, respectively, and new game discs and corresponding multi-player games (MMOG) are introduced with 3-D virtual and augmented advertising.
 Local digital directories are now larger than print Yellow Pages, thus the double-digit decline in print advertising does not adversely affect the industry when publishers no longer distribute three editions (city, neighboring towns, county), but only release the local edition. Online Yellow Pages have actively added mobile apps, linking to proximity services to provide coupons to on-the-go consumers. Despite the growth of digital directories, overall local directory advertising declined 0.4 percent overall to $5.88 billion in 2018.
Note: PQ Media is the source of all 2018 size and growth data cited, except PPAI used for promotional products. Media silos are hybrids of traditional and digital media platforms, such as the combination of terrestrial television advertising with branded digital advertising (ex., ad revenues generated by commercials on WCBS and other CBS owned stations + CBS-TV + CBS.com + CBS Mobile + CBS Free VOD + CBS on Netflix).
––––––––––––––––––––––––––––––––––––––––––––––––––––––––––––––––––––––
Patrick Quinn is president and CEO, and Leo Kivijarv, Ph.D., is EVP and research director of PQ Media. The firm, based in Stamford, Connecticut, is a leading provider of global media econometrics and a pioneer in emerging media research. Its industry-leading predictive econometrics system serves executives charged with advancing strategic initiatives in the rapidly changing media, entertainment and communications industries. www.pqmedia.com