The Tipping Point Realized

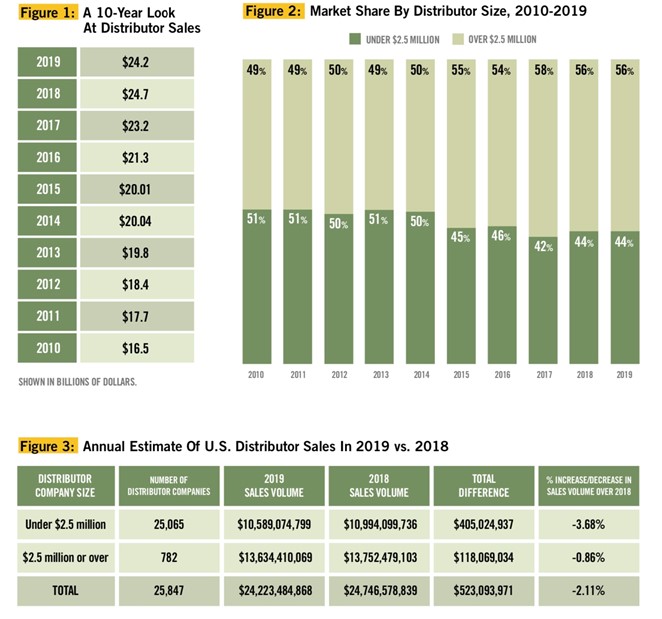
It was a year of slow decline for all promotional product distributors. While industry sales in 2019 decreased 2.11 percent from 2018 sales, the total remained just above the $24 billion mark at $24,223,484,868. (See Figure 1 for a 10-year tracking summary). The decrease is the first drop in distributor sales since the 2008-2009 downturn brought on by the recession.
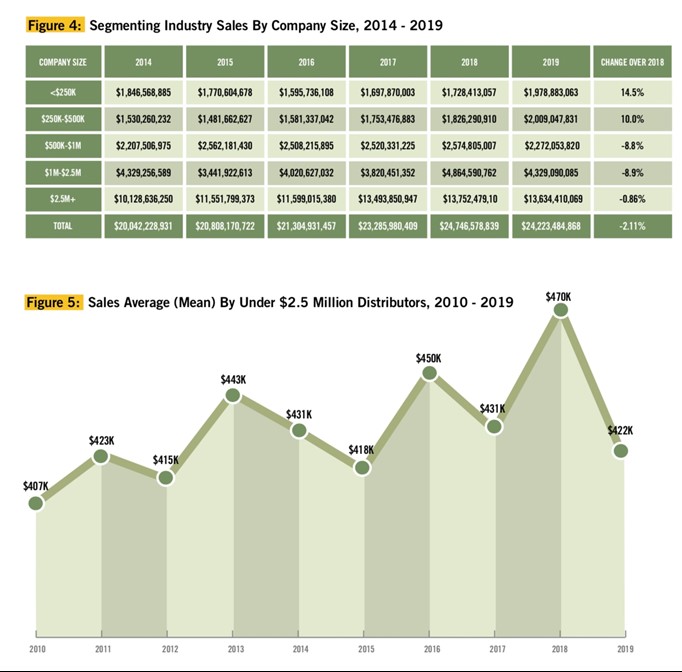
Overall, the decrease was driven by declining sales from small distributors (companies with annual sales under $2.5 million). This group experienced a 3.68-percent decrease in 2019 over 2018, while sales for larger distributors dropped only 0.86 percent. Within this group, companies with sales between $500,000 and $1 million declined 11.8 percent and those with sales between $1 million and $2.5 million declined 11 percent. However, there was some growth in this segment. Small distributors with sales up to $250,000 experienced the highest growth (14.5 percent), followed by those with sales between $250,000 and $500,000, which saw a 10-percent growth. But the growth in these smaller tiers wasn’t enough to offset the losses in the higher tiers, resulting in an average decline of 3.68 percent for the small distributor segment.
While annual sales for small distributors weakened, the estimated number of companies in this cohort grew to 25,065 from 23,400 in 2018. This rise may be due to an expanded list of companies invited to participate in the survey as more small printing and graphic design companies enter the promotional product space. However, the number of large companies reporting sales over $2.5 million declined from 840 in 2018 to 782 in 2019. The total number of U.S. distributor companies participating is estimated at 25,847, compared with 24,240 in 2018.
Another area that contributed to the decline in overall sales was the share of online sales of promotional products. This segment represented 18.6 percent of sales in 2019, down from 24.7 percent in 2018. Total online sales volume declined by 25.1 percent to $4,498,321,163, compared to $6,007,044,117 in 2018, disrupting the previous years’ trend toward growth in online sales for both large (down 30 percent) and small distributors (down 8.3 percent).
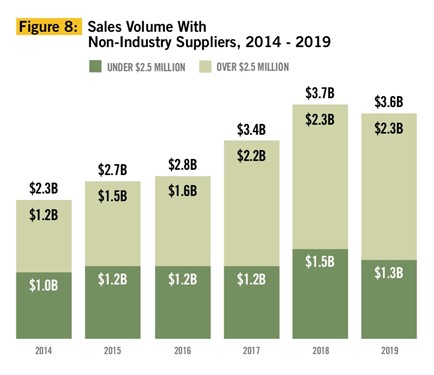
The trend of distributors buying from non-industry providers was also interrupted in 2019. On average, distributors sold $3,605,923,177 worth of products purchased from non-industry providers, or 14.9 percent of the total dollar volume. Sales from non-industry providers declined by 3.4 percent over 2018.
The bright spot in this survey was the rise in sales of retail branded products with a 46-percent increase over 2018 and estimated sales of $5,359,867,165 in 2019.
–––––––––––––––––––––––––––––––––––––––––––––––––––––––––––

In terms of market share, the 782 firms representing large companies with over $2.5 million in annual sales captured $13,634,410,069 of the business—a 56.29-percent share. These included franchisors like AIA Corporation, Proforma and HALO Branded Solutions, and these firms report for their franchisees. Sales from smaller distributors as a group amounted to $10,589,074,799 or 43.71 percent (see Figure 2).
Last year’s sales decline didn’t discriminate—both large and small distributors experienced negative growth. Small distributors with total orders of approximately $10.6 billion dropped 3.68 percent from a strong 12.27-percent spike in 2018.
For large distributors, the average decline wasn’t as severe. Distributors in the $2.5 million-plus bracket recorded sales of $13.6 billion, showing an average loss of 0.86 percent over 2018 (see Figure 3).
Not all small company categories experienced a decline in sales in 2019. The most notable growth was found among companies with up to $500,000 in sales, while those with higher annual sales saw a decline (see Figure 4).
The average revenue for the 25,065 firms in the small-company segment was $422,465, down from $469,833 in 2018, while the median—that is, the midpoint where half the population is above, and half is below—was $150,000, compared with $130,150 in 2018 (see Figure 5).
–––––––––––––––––––––––––––––––––––––––––––––––––––––––––––

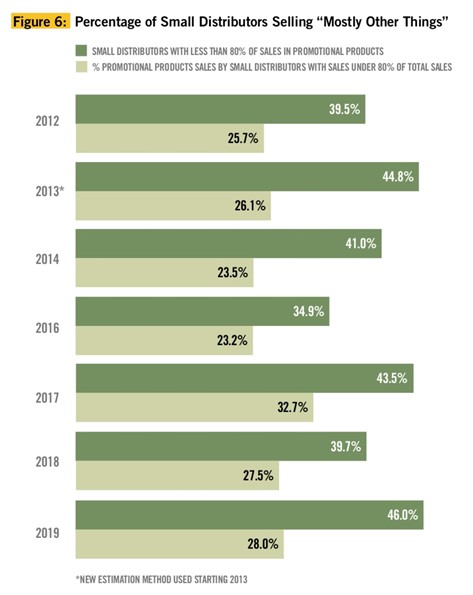
Although promotional products continued to be a second revenue stream for many small and large distributors, fewer “full-time” distributors participated in the 2019 study. In 2019, more small companies that participated in the survey (45.95 percent) did less than 80 percent in sales of promotional products (see Figure 6).
These distributors sourced 22 percent (down from 28 percent in 2018) of their revenue from promotional product sales and 78 percent from some other segment. Sales from these dual-revenue-source distributors accounted for 27.9 percent of the sales volume in the small-company segment, a slight increase from 27.5 percent in 2018.
–––––––––––––––––––––––––––––––––––––––––––––––––––––––––––
![]()
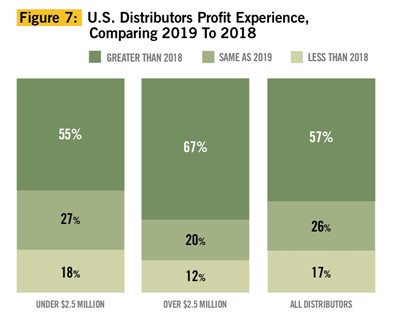
On average, the number of distributors reporting profit growth in 2019 decreased over 2018. Fewer distributors (57 percent) reported higher profits than the prior year (59 percent). Large distributors experienced the steepest decline, with 67 percent reporting higher profits in 2019 compared to 75 percent in 2018. Small distributors also saw a drop in profits in 2019 (55 percent), which is just shy of the 2018 figure (56 percent) (see Figure 7).
–––––––––––––––––––––––––––––––––––––––––––––––––––––––––––

On average, the number of distributors doing business with non-industry suppliers declined in 2019. Fewer small distributors reported doing business with outside suppliers in 2019 (12.17 percent), down from 13.45 percent in 2018. The number of large distributors that reported doing business with non-industry suppliers increased in 2019, though only slightly, from 16.5 percent in 2018 to 16.99 percent (see Figure 8).
–––––––––––––––––––––––––––––––––––––––––––––––––––––––––––
![]()
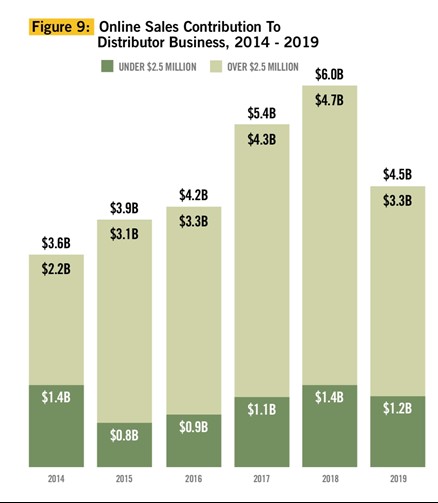
Online sales are defined as buys resulting from orders placed through an online store or website. Web sales—not to be confused with salespeople transmitting orders online—are estimated to be $4,498,321,163 or 18.57 percent of the total sales in the promotional products industry.
The proportion of online sales to total sales in the industry are lower for the first time since 2012, dropping from 24.3 percent in 2018 to 18.6 percent in 2019. Overall, the online sales volume decreased by 25.1 percent, which was driven by a 30-percent decline in online sales for large distributors, and an 8.3-percent decline for small distributors. Large distributors reported the harshest decline in online sales, from 33.83 percent in 2018 to 23.88 in 2019 (see Figure 9).
–––––––––––––––––––––––––––––––––––––––––––––––––––––––––––

Retail branded products are defined as consumer-facing, brand-name products that add a sense of distinction to incentive and recognition programs as well as end-user gifts.
Sales of retail branded products are estimated to be $5,359,867,165, or 22.1 percent of the total sales in the promotional products industry in 2019. This represents a 46-percent increase over 2018, when the question was asked for the first time in this survey. The number of distributors selling retail-branded products increased among both large and small segments. Among large distributors, nearly all of them (98 percent) sold retail-branded promotional products, down from 96 percent in 2018, compared with 87 percent of small distributors, up from 79 percent in 2018.
–––––––––––––––––––––––––––––––––––––––––––––––––––––––––––
![]()
Sustainable products are defined as products marketed to consumers for their eco-friendly attributes either through its production, use or disposal. Examples include, but are not limited to, reusable products, products made with pre- or post-consumer recycled materials, products made with biodegradable or compostable materials, products with third-party verification or labeling, products offering take-back programs and/or products made in the USA.
The question of net sales in relation to sustainable products was asked for the first time in this survey, and are estimated to be $2,789,867,346, or 11.5 percent of total industry sales.
Among large distributors, nearly all (99 percent) sold sustainable promotional products, as did 78 percent of small distributors (see Figure 10).

–––––––––––––––––––––––––––––––––––––––––––––––––––––––––––
Log-In For More Details
Get the full report, including additional data, charts and the list of top-selling products and programs at www.ppai.org/members/research. The report is available to PPAI members only and a log-in is required. For questions on this report, email KeithV@ppai.org.
–––––––––––––––––––––––––––––––––––––––––––––––––––––––––––
How This Survey Was Conducted
PPAI has researched and released industry sales data since 1965. This annual distributor sales survey is generally considered the most definitive and comprehensive of its kind in the industry based on actual sales reported by U.S. promotional consultant companies. The survey was conducted by Relevant Insights LLC, an independent market research, on behalf of PPAI.
The survey was distributed both via email and mail to more than 29,000 distributors, both PPAI member and non-member promotional consultant companies. Companies had the option to answer the survey online or return it by mail. The top 50 distributors were also reached by phone to make sure their information was included in the analysis since omission of any distributor with a large volume of business could distort the statistics. A census of all distributors doing $2.5 million or more in sales was also included. Combining the samples from the different data collection methods used resulted in a projected total of 25,847 distributors (25,065 small firms and 782 large firms) covering the entire U.S. industry.
–––––––––––––––––––––––––––––––––––––––––––––––––––––––––––
Michaela Mora is principal of Relevant Insights, LLC.