
Strong And Steady
Distributor Sales Continue To Surge Forward With Smaller Distributors Making The Biggest Gains In 2016
It was a year of positive but slow growth for large companies. Compared to 2015, the gap between small and large distributors shrank in 2016. Small distributors came back from a significant decline in 2015, experiencing notable, positive growth, while large distributors grew at a much slower pace last year.
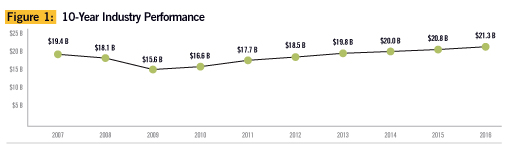
Overall, in 2016 distributor sales increased by 2.39 percent to a record $21,304,931,457, continuing an upward trend that began in 2010 (see Figure 1). However, the net positive results stem mainly from increased revenue among small distributors (those with annual sales under $2.5 million). This group experienced a 4.86-percent increase over 2015, while larger companies saw only a 0.41-percent increase in sales during the same period.
Another trend the study noted is that the pool of distributor companies appears to be shrinking, especially among smaller distributors, and large companies edged up slightly. The total number of U.S. distributor companies in 2016 was estimated at 22,466, down from 23,021 in 2015. Of those, the number of companies with sales less than $2.5 million that reported promotional products sales declined to 21,577 from 22,153 in 2015. The number of large companies with sales of $2.5 million or more reporting sales increased slightly to 889, compared to 868 in 2015.
Despite the overall sales volume growth, more companies reported a decrease in sales. Nearly six out of 10 companies (58 percent) indicated their sales grew over 2015, while about 17 percent had the same levels in sales, and 25 percent saw a decline in sales (20 percent in 2015).
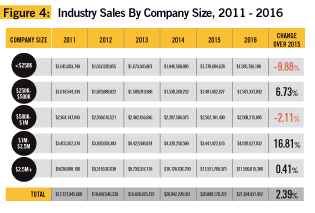
In 2016, smaller distributors experienced stronger sales growth than larger distributors, although there is variation among subgroups. Among smaller distributors, those with less than $250,000 in annual sales experienced the greatest decline, while distributors in the $1 to $2.5 million bracket saw the most growth.
After big wins in 2015, large distributors (those with sales of $2.5 million or more) experienced a small increase in sales during 2016. Compared to 2015, fewer large distributors (68 percent vs. 79 percent in 2015) reported increased sales in 2016, while the decline among smaller firms was less steep (56 percent vs. 58 percent in 2015).
Comparisons By Company Size
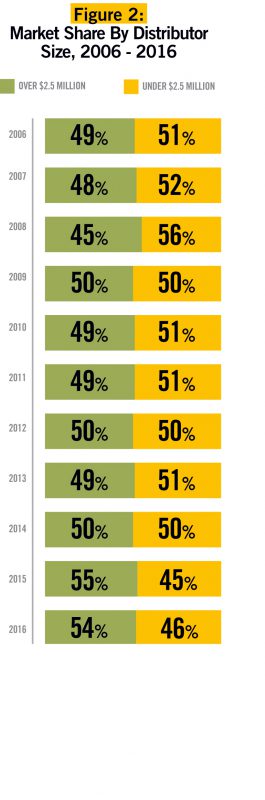
In terms of market share, the 889 firms representing large industry companies (sales of $2.5 million or more) captured $11,599,015,380 worth of the business in 2016—a 54.4-percent share. It should be noted that the large-company segment included franchisors like AIA (Adventures in Advertising), Proforma and iPROMOTEu, and these firms report for their franchisees. Sales for the more numerous smaller distributors as a group amounted to $9,705,916,077, or 45.6 percent. Large distributors continued to account for a larger proportion of the total sales volume than smaller firms (see Figure 2).
Unlike 2015, small distributors experienced positive growth, while large distributors grew at a slower pace. Distributors in the $2.5 million-plus bracket recorded sales of $11.6 billion, showing small gains at a 0.41-percent increase over 2015 (see Figure 3).
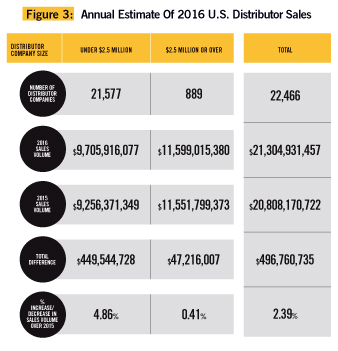
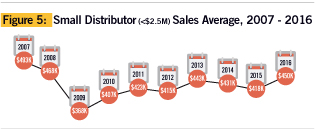
On the other hand, the small company segment saw a greater increase of 4.86 percent with total orders of approximately $9.7 billion. A look by sub-segment reveals that half of the small company categories saw a decrease in sales in 2016. The sub-segment with sales under $250,000 experienced the greatest decline, while those in the $1 - $2.5 million segment grew the most (see Figure 4). The average revenue for the 21,577 firms in the small-company segment was $449,835 (compared to $417,846 in 2015), while the median—that is, the midpoint where half the population is above and half is below—was $176,750 (compared to $219,000 in 2015).
Promotional Products: A Secondary Revenue Stream
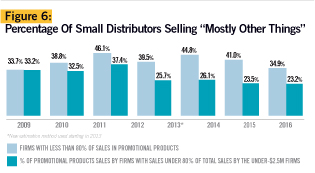
Promotional products continue to be a secondary revenue stream for many of the industry’s 21,577 smaller distributors (and some larger ones, too) (see Figure 6).
In 2016, fewer small-company survey respondents (35 percent) did less than 80 percent of total revenue in sales of promotional products. These distributors sourced 27 percent (up from 23.5 percent in 2015) of their revenue from promotional product sales, and 73 percent from some other field.
Sales from these dual revenue-source distributors accounted for 23 percent of the sales volume in the small-company segment, which is on par with last year’s results.
 The Profit Picture
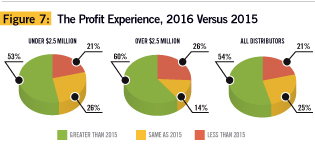
In 2016, fewer distributors (54 percent) saw greater profits over the prior year
(60 percent), a trend that affected large distributors in particular (60 percent vs. 77 percent in 2015). Fewer small distributors also reported an increase in profits (53 percent), but the difference with the prior year was smaller (57 percent).
A quarter of distributors saw the same profit levels as in 2015, while slightly more than one fifth experienced lower profit levels (see Figure 7).
Michaela Mora is principal of Relevant Insights, LLC.
Find the full report “The 2016 Sales Volume Estimate” at www.ppai.org/research.
Distributor Sales, Profits Expected To Be Stronger In 2017
by Michaela Mora
Companies that participated in the 2016 survey are optimistic both about sales and profits for 2017, a sentiment that’s especially strong among small distributors. The survey showed that two out of three small distributors (annual sales less than $2.5 million) expect greater sales growth (66 percent) and profit (62 percent) for 2017 compared to 2015 (65 percent and 60 percent, respectively). Many believe the new White House Administration will create a better business environment that will benefit them.
On 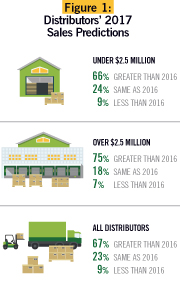 the other hand, fewer large distributors (75 percent) have a positive outlook regarding sales and profit (68 percent) for 2017, compared to 2016 (82 percent and 76 percent, respectively). (See Figure 1)
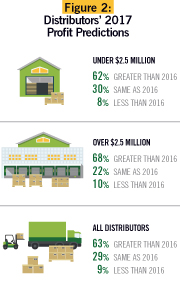
Many companies are equally optimistic about profits in 2017. Slightly more than six out of 10 respondents expect higher profits in 2017 (see Figure 2).
Greater Profit: 2017 vs. 2016
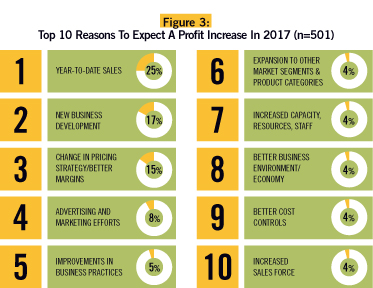
Many more companies that expect greater profits based their prediction on increased sales during the first quarter of 2017, new business development efforts and changes in pricing strategy to increase profit margins (see Figure 3). A few believe the new White House Administration will create a better business environment.
Study Methodology
To compile PPAI’s 2016 Estimate of U.S. Distributors’ Promotional Products Sales, the survey was distributed both by email and mail to more than 25,000 distributors, both PPAI member and nonmember promotional consultant companies. As in previous years, the sample was drawn from a merge/purge of several separate industry databases, including PPAI and UPIC (Universal Promotional Identification Code) lists.
The Top 50 distributors were also reached by phone to make sure their information was included in the analysis since omission of any distributor with a large volume of business could distort the statistics. A census of all distributors doing $2.5 million or more in sales was also included.
Combining the samples from the different data collection methods used resulted in a total of 22,466 (21,577 small firms and 889 large firms) distributor surveys covering the entire U.S. industry. Completed replies collected by internet, phone and mail resulted in 910 usable surveys (a 3.52 percent response rate) which, combined with census data, provided a total of 1,662 records used in the analysis. The margin of error was ± 4.14 percent at the 95 percent confidence level.
Drinkware Pulls Ahead For Second Place Behind The Perennial Winner: Wearables
by Tina Berres Filipski
If promotional products sales by category were a foot race, wearables (apparel including footwear, scarves, ties and more) would be so far in the lead all an observer would see is a speck fluttering in the distance. That would leave the next three contenders in stiff competition for second place. With writing instruments, bags and drinkware speeding forward or falling back a few strides every year, it continues to be a very competitive race.
In 2017, wearables held its historic lead with a record 34.28 percent of sales but the new second place winner was drinkware at 9.45 percent of sales (7.54 percent in 2015), bags at 8.24 percent (7.87 percent in 2015) and writing instruments at 7.7 percent (7.67 percent in 2015).
Perhaps not surprisingly, the only other product category with a noticeable increase was computer products at 4.75 percent (4.17 percent in 2015). However, its related category, electronic devices and accessories, decreased from 3.05 percent in 2015 to 2.20 percent in 2016. So, the difference may be in the way distributors are now tracking sales in this popular product category.
In promotional program categories, the program type that really pulled ahead in 2016 was brand awareness. It grew from 12.24 percent in 2015 to 13.95 percent last year. Most of the other categories were relatively flat, with the exception of dealer/distributor programs, which fell from 7.04 percent in 2015 to six percent in 2016, employee service awards, which fell from 6.08 percent to 5.15 percent, and employee relations and events, which fell from 11.95 percent in 2015 to 11.02 percent last year.
Distributors Speak Out About 2017 Sales Forecasts, Business Challenges
PPB spoke with principals at seven large, mid-size and small distributor companies to get their take on sales expectations for this year and the challenges that are affecting their business.
by Tina Berres Filipski
Matt Gresge
CEO
AIA Corporation
(PPAI 101364)
Neenah, Wisconsin
Company Founded: 1981
Key Markets Served: AIA distributors provide support to entrepreneurs and marketers across a wide variety of industries and markets.
Types Of Services Offered: AIA provides its distributors with a unique blend
of business acumen, sales expertise, marketing support, technology platforms, merchandising and peer networking.
How is your business faring so far this year? “The first four months of 2017 have been a rollercoaster, with sales up relative to 2016 in one month, then down the next. January was up, February was down, March was up, April was down. May is slightly above the same period last year and, on balance, we’re up in the low single digits over 2016.”
What is your anecdotal forecast for the company by year-end? How will it be different from 2016? “Booked orders, which AIA uses as a leading indicator, are showing robust growth over 2016, so we’re bullish on continued year-over-year growth for AIA’s network sales. We’re projecting to finish 2017 with network sales up three to five percent over 2016. The distinguishing feature of 2017 has been the dramatic month-to-month swings in billed sales.”
What are your biggest challenges for the company or industry? In other words, what are you most concerned about? “At AIA, we share our distributors’ obsession with the end consumer, so we’re paying close attention to the buying behaviors of the end consumer. As we look over the marketplace, we see Millennials becoming the dominant generation in charge of purchasing promotional products, we see digital content replacing the order-taking salesperson as the end buyer’s primary source of awareness and purchase consideration, and we see the difficulties established distributors have in contending with these dynamics. The new team at AIA is working around the clock to be sure our distributors are well armed to compete and win in this rapidly changing market.”
Memo Kahan
President
PromoShop, Inc.
(PPAI 204997)
Los Angeles, California
Company Founded: 1998
Key Markets Served: All markets in most regions
Types Of Services Offered: Marketing services, sales of promotional merchandise, creative services, art creation and campaign design, warehousing, fulfillment, kitting
How is your business faring so far this year? “Business in 2017 has been steady and good. We continue to see more orders for less money, yet there are big opportunities that make up for the difference. Client interaction is good and lines of communication are looking up for us to have a very good 2017. Our business is up and our margins are staying in a good place. All indications are that we are adding value to each client and transaction.”
What is your anecdotal forecast for the company by year-end? How will it be different from 2016? “I am hopeful that the rest of the year will be similar to the first five months—lots of orders, lots of issues with suppliers and many opportunities to be had. Actually, it will be very similar to what we saw in 2016 minus the election fright. I believe promotional merchandise will remain a wonderful vehicle to promote and expand campaigns and brands. I expect us to be very busy and have great success.”
What are your biggest challenges for the company or industry? In other words, what are you most concerned about? “The main challenges we see are twofold. The first is the budget allocation of marketing dollars. Lots of money is being allocated to digital media and online advertising, taking away from the other forms of advertising.
I do believe that we are a bit under the line of expenditures, thus we hope our budgets will be left alone and spending will continue. The other concern is about the lack of new markets. Distributors continue to cannibalize the marketplace and are fighting for the same available dollars.
The only way to win is usually by lowering prices or adding service. The lowering of prices is unfortunately winning. My concern today is the supply chain and their ability to successfully ship orders. We are in a place I have never experienced before. There are too many mistakes in too many orders. We are spending too much time trying to fix and trying to explain to our clients what is happening. This needs to get better before our clients decide we are too much of a liability and they take their money to other areas of marketing.”
Adam Thornton
President
Match-Up Promotions
(PPAI 347438)
Longwood, Florida
Company Founded: 2002
Key Markets Served: Food and beverage, health care, game-day premiums (NFL/NHL/NBA/MLB), financial services
Types Of Services Offered: All areas of corporate branded merchandise, custom product sourcing, online programs and fulfillment, print procurement
How is your business faring so far this year? “We went into 2017 with the belief that our largest account, in terms of revenue, would be moving forward with another distributor. While this occurrence, on the surface, presented a frightening top-line impact, we utilized this development to focus our approach on growing other key accounts, and pursuing markets and prospects that had been underdeveloped.
We have been aggressively developing new software that will allow our team to present our clients and prospects with an integrated brand portal that will manage both branded merchandise and print collateral. While organic growth is always priority No. 1, we plan on continuing to look at strategic acquisitions to increase our national reach and increase our service capabilities to clients. If I had to sum up the first half of the year in a brief statement, I’d say we’ve replaced labor-intensive accounts with an influx of smaller, yet more profitable accounts while allocating a record amount of capital to advance our technology offerings to better position ourselves not for 2017 but for 2020.”
What is your anecdotal forecast for the company by year-end? How will it be different from 2016? “From a financial perspective, we expect overall revenue to be in line with 2016 (in spite of the single client loss) with improving gross margins. Our cost structure will be higher due to the increased costs for software/technology development, with many of the initiatives not expected to generate revenue until 2018. Match-Up will be in a far more advantageous position for accelerated growth in future years due to the resources we are developing in 2017. Our industry, like all others, is in a state of disruption and we intend to capitalize on that disruption.”
What are your biggest challenges for the company or industry? In other words, what are you most concerned about? “While this is not new, the continued education of clients as it pertains to the advertising/marketing impact of branded merchandise is always at the top of the discussion. Branded merchandise is a remarkably effective marketing tool and we need to continue to educate our clients. Like I mentioned earlier, our industry is in a state of disruption.
We need to be able to offer clients informed product recommendations but we also need to be able to take the same service levels, the same ‘relationship’ and morph it digitally. From a retail perspective, I like to call it the Zappos experience. Simple, fast, pleasant.
We need to be able to provide clients with branded merchandise and print collateral that positively impacts their brand but to be able to take this same approach offline or online. How do we create the same ‘wow’ experience in person or via the internet/mobile? You can be honest with yourself and strategically plan to adapt and understand that buyers are changing and technology is going to continue to make the industry more transparent and global, or you can continue to ignore and face the repercussions.”
Bert Williams, MAS
CEO
Williams & Associates
(PPAI 109552)
Tucson, Arizona
Company Founded: 1977
Key Markets Served: Travel and tourism, hospitality
Types Of Services Offered: Full service; marketing promotions, graphic design, event and trade-show planning, catalog and fulfillment programs, employee recognition and safety programs, apparel and uniform.
How is your business faring so far this year? “We are up double digits. In comparison, I just looked at the last three months of 2016 and that time frame was down six percent (2016 vs 2015). Looks like Trump made a difference.”
What is your anecdotal forecast for the company by year-end? “Our average
sale has gone up this year about 10 to 12 percent. However, the number of sales is only up three percent. Barring any unforeseen political/worldwide event, we should hold to the 10- to 12-percent increase for this year.”
What are your biggest challenges for the company or industry? In other words, what are you most concerned about? “Getting new salespeople. Millennials aren’t interested in straight commission jobs. We’ve got to change our way of looking at compensation. They’ve been taught that they ‘deserve,’ while older generations were taught to ‘earn.’ This is not a slam against Millennials. Those of us who are older will have to shift gears and learn how to welcome them into the fold.
In the long run, we’ll get the same results. Our average salesperson has been with us for 28 years. Some are nearing retirement. Williams and Associates’ challenge will be to figure out how to segue younger replacements into success. We’re fortunate in that my wife, Anne, and I have three kids in the business who will hopefully accept the challenge with help from mom and dad.”
Heather Comerford
CEO
1338Tryon
(PPAI 649357)
Portland, Oregon
Company Founded: 2014
Key Markets Served: Commercial trucking/automotive, manufacturing, high tech, athletic/leisure
Types Of Services Offered: Online company stores, branded apparel, branded merchandise, promotional products, years-of-service programs, employee tenure programs, sales incentives, corporate gifts, recognition programs, holiday gifts, awards, printed collateral, trade show displays and giveaways, event gifts, signage and fulfillment
How is your business faring so far this year? “Fan-freakin-tastic! Looking to double our revenue by the end of the year.”
What is your anecdotal forecast for the company by year-end? How will it be different from 2016? “1338Tryon was established at the tail-end of 2014 so 2015 was a lot of heaving lifting, as in getting used to new systems, establishing ourselves with suppliers and creditors, and letting our projected client base know we existed. 2016 was a big business development year for us and our first full year managing online stores. 2017 has been great—all our hard work is paying off—we are onboarding several new online stores and expanding our client base. Every day is Shark Monday—we are up early, biting stuff, chasing stuff, being scary— reminding everyone we are sharks.”
What are your biggest challenges for the company or industry? In other words, what are you most concerned about? “Space. Between Amazon’s Prime Now service and our recent legislative support for the ‘green’ industry here in Oregon, space is at a premium in Portland. Perhaps we will start warehousing in markets outside our home base this year.”
Carey Guglielmo
President and Owner
AST Marketing Group
(PPAI 627183)
Baton Rouge, Louisiana
Company Founded: 2014
Key Markets Served: Industrial, financial, insurance, health care, automotive, and food and beverage
Types Of Services Offered: E-commerce and premium co-branded merchandise
How is your business faring so far this year? “Year to date we are plus 32 percent in revenue. More importantly, our gross margin has seen significant growth.”
What is your anecdotal forecast for the company by year-end? How will it be different from 2016? “Our expectation, and more importantly our forecast, at AST is for this growth to continue to move north.”
What are your biggest challenges for the company or industry? In other words, what are you most concerned about? “Without question, our largest concern for the industry remains the lack of technology adoption. We feel the industry is behind the curve on this front and thus potentially spurns strategic growth.”
Rama Beerfas, MAS
Owner
Lev Promotions
(PPAI 218331)
San Diego, California
Company Founded: 2002
Key Markets Served: Trade-show exhibitors
Types Of Services Offered: Full-service marketing agency services, promotional products, marketing and customer service training
How is your business faring so far this year? “Business is up by about 30 percent year to date, year over year.”
What is your anecdotal forecast for the company by year-end? How will it be different from 2016? “I expect the 30-percent increase to hold steady through the rest of 2017. Our business is coming more from trade-show exhibitors and working with them on their actual exhibit space, staff training and other exhibit-related marketing needs.”
What are your biggest challenges for the company or industry? In other words, what are you most concerned about? “I am a one-person company, so growth is always a challenge in making decisions about what parts of my business I can outsource and at what point I may need to hire someone to handle some of the load. As an industry, the biggest challenge is overcoming the ugly stepsister perception of promotional products in the world of marketing.”
Tina Berres Filipski is editor of PPB.
Scoreboard: The 2016 Ups And Downs Of Competing Media
by Richard Alan Nelson, PhD and Rick Ebel
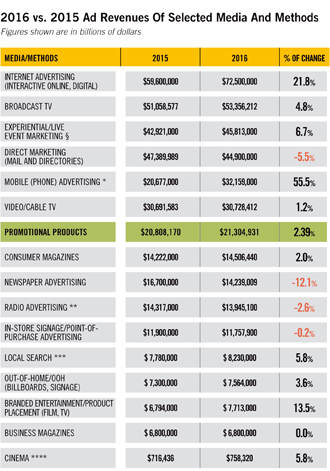 What a year! A recent magazine article headline declared “The Final Word on 2016 Advertising: Great!” For some media, that description was accurate. But for others, not so much. The table on the next page, prepared exclusively for PPB, compares advertising revenues for selected media and demonstrates this media volatility.
Internet Advertising Leads The Pack
In the scramble for revenues there are always winners and losers. Not surprisingly, internet advertising revenues reached most experts’ projections of becoming the largest advertising medium, with total ad spend in 2016 of $72.5 billion. This figure for interactive online media advertising includes data revenues from websites, commercial online services and email providers, as well as other companies selling online advertising.
But there are a few headaches for some advertisers who put complete faith in digital. That’s because the ad world has changed from the old days when you had some control over where your ad is placed. Nowadays many digital ads are placed on websites by computer algorithms, says Associated Press technology writer Tali Arbel.
“It’s not always easy for these companies to steer their ads away from sites they find objectionable.” The writer cites an ad from the Walgreens drugstore chain that “popped up next to the child-prostitution story on the site The Red Elephants ...”
Bruce Biegel, senior managing director of the Winterberry Group, indicates a subtle change in thinking as such interactive advertising becomes more commonplace. While “… digital media spend is something we watch,” he says, “it’s not as important anymore because digital is part of life in marketing today.” Incidentally, Winterberry uses many of the same adspend sources that we do.
Product Placement Doing Well
Paid product placement revenues rose at a double-digit rate in 2016 and will continue to do so again in 2017, according to Dr. Leo Kivijarv, executive vice president and director of research at PQ Media. That growth is “because brands are becoming more sophisticated in using the media platform, such as integrating products into TV and film scripts rather than as background cameos, as well as targeting Millennials through paid placements in music videos and videogames.”
Live Events
Meanwhile, according to Kivijarv, live events (also known as experiential marketing and includes consumer event marketing and business-to-business trade shows and conferences) grew at a high single-digit rate in 2016 “because live events are becoming a crucial part of brand budgets due to a significant rise in digital media ad blockers in which brand are unaware whether their ads reached the intended audience. Live events allow brands the opportunity to engage with their core clients/customers in a one-to-one conversation in which they can address specific needs.”
Why So Many Declining Numbers?
Does the rise of digital mean doom for the older, conventional media? Maybe for some. PwC has issued its latest annual Entertainment & Media Outlook report, containing projections for online and offline media advertising markets through 2020. It notes the “outlook for traditional media advertising is similar to previous forecasts in that TV and out-of-home advertising have the healthiest futures, while the outlook for print (at least in print format) is dim.”
Daily newspapers are certainly hemorrhaging as print continues to lose readers and advertisers. Business publications are flat. Even direct mail has been taking a beating, although you’d never know it when visiting your mail box.
What About TV And Video?
SNAP Inc. (think SnapChat) has boldly forecast the demise of broadcast TV. One reason— consumer mobility. According to GfK MRI’s latest Survey of the American Consumer, when it comes to TV many millennials prefer to view content when and where they want it.
“Quickly becoming the largest generational group of cord-free watchers, Millennials (ages 18 to 34) account for 43 percent of those who have cut the cord on or never signed up for TV service delivered by cable, satellite or telco companies,” states the survey. “Almost one third of Millennials are cordless, compared to just 16 percent of boomers.”
But Brian Weiser, media analyst for Pivotal Research Group, disagrees with the doom and gloom prognosis for broadcasters. He suggests we not be too quick to count out conventional TV viewing, which he claims, “has likely risen slightly across all age groups over the last six years.” He says he finds that as 18-year-olds age to 24-year-olds, they tend to watch more traditional television. That means, Weiser says, on large screens in the living room, not on smartphones. And in 2016, the broadcast industry was actually among the “old” media that profited nicely (up 4.8 percent) in a year juiced by a presidential election and the summer Olympics.
Some of that viewing is also going to streaming “Over-the-Top/OTT” video services such as Netflix, Hulu and Amazon Prime Video (up a healthy 31.7 percent in 2016), although those services do not accept advertising.
Another medium that looks good to some forecasters is the out-of-home (OOH) category. According to researchers at Borrell Associates, out-of-home has grown 77 percent in the past half-dozen years. It’s best to keep in mind that OOH covers more than just billboards. The variegated medium also takes in transit signs, sports arenas, shopping malls, gas pumps and even bathroom-stall doors.
Such variety is familiar to the folks who sell promotional products. Take a look at the program category pie chart on page 50 and you have to be impressed by the range of promotional and incentive applications, from brand awareness to business gifts.
Brand Activation
Finally, Kivijarv warns that any discussions about advertising completely miss the point if they don’t include reference to marketing media, also known as brand activation. “Brands spend almost twice as much on marketing media, including promotional products, according to research conducted by PQ Media in collaboration with the Association of National Advertisers,” he says. Kivijarv also states that brand activation accounted for almost two thirds (64 percent) of the $529 billion of revenue generated in 2016 by advertising, marketing and trade promotion operators.
So, tighten your seat belts and keep your eyes open—the coming months are likely to be quite interesting as well as challenging for those selling advertising and marketing products.
Expenditures for selected advertising and promotional methods were compiled for Promotional Products Association International by Richard Alan Nelson PhD, University of Nevada-Las Vegas, and Rick Ebel, Glenrich Business Studies, Corvallis, Oregon. NOTE: Year-to-year, these figures are subject to revision upward or downward based on research updates by credible industry sources. For this year’s figures, sources include Associated Press, BIA/Kelsey, Borrell Associates, Cinema Advertising Council, Convergence Research Group, Data & Marketing Association (DMA), Euromonitor, GfK MRI, GroupM, Interactive Advertising Bureau, Kagan/S&P Global Market Intelligence, MAGNA/IPG Mediabrands, MediaRadar, MoffettNathanson Research, MPA – The Association of Magazine Media, Outdoor Advertising Association of America, Pivotal Research Group, PQ Media, PwC, Shop!/shopassociation. org, SNAP Inc., Standard Media Index, The Street, Winterberry Group and Zenith.